Series Group
tip
Only users with Dashboard privilege have access to this section!
Read 5 minutes tutorial here.
Series Group: This video contains how to use Series Group in OPNBI.

- Group used in pie chart to make group of values available in pie chart, user can control the number of groups to visualize in widget.
As User enable the group using the toggle button, its menu gets appear.

The Threshold is used to control the number of pie slices in chart widget.
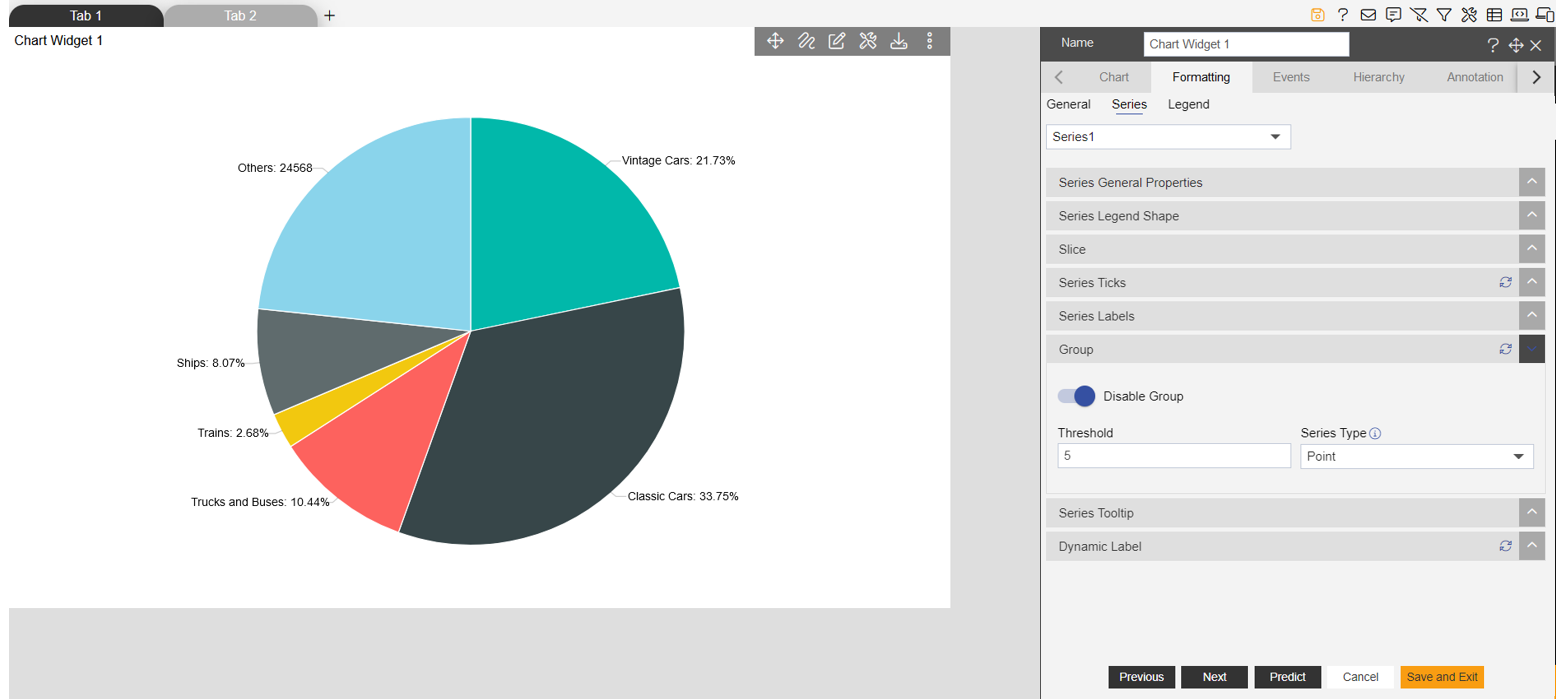
Series Type: It has two series type like points and values
Point Series Type: The point use for how much points of threshold should be visible on chart. If user add 5 then it takes 5 slices for visualization and take other to the group. as shown in figure below:
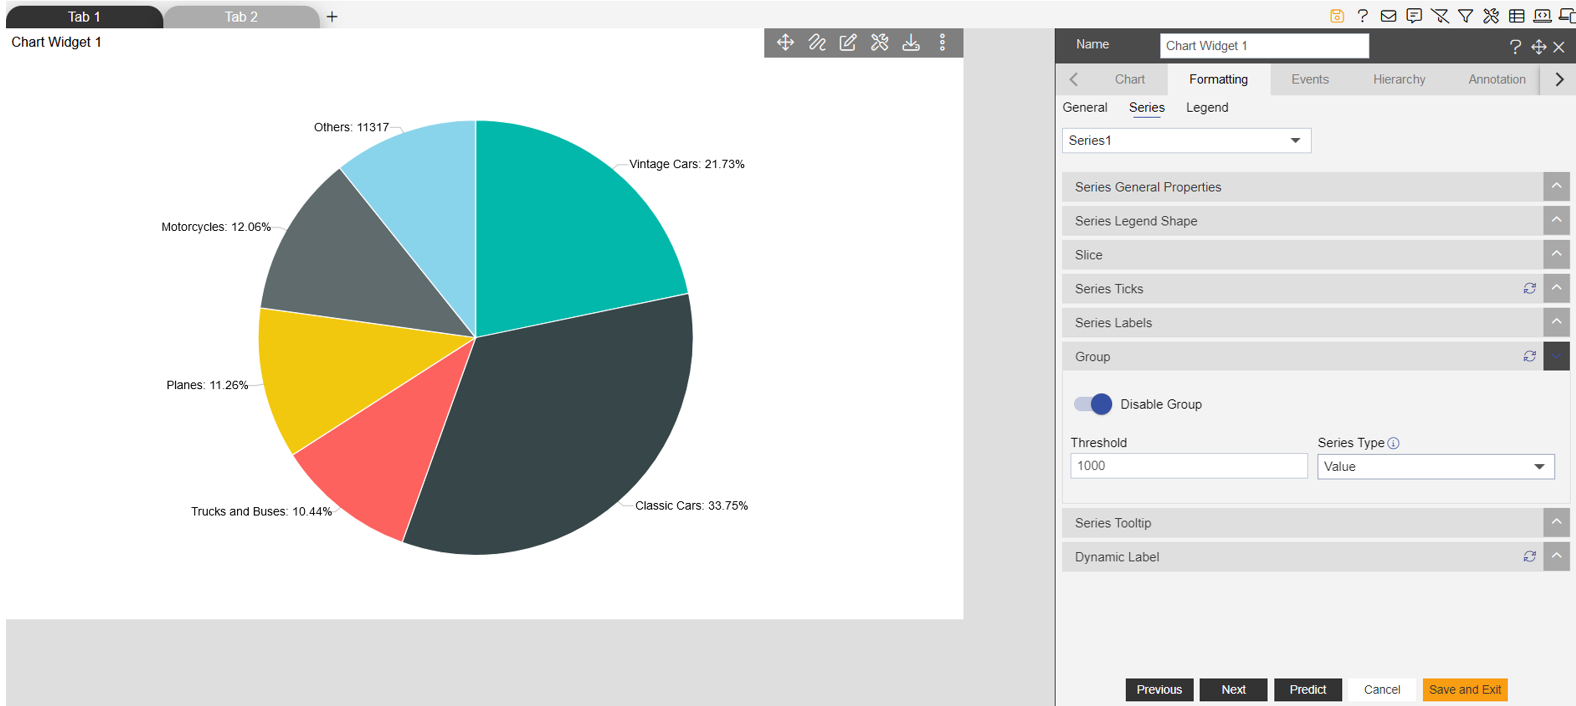
Values Series Type: The value use for how much values of slices should be visible in chart.
To know more about other Series properties click on below links:-